
KPI Dashboards Set-Up
How do I create KPI Dashboards?
KPI Dashboard is a visibility tool for contact centers and customer support operations.
Configuring and displaying all chat and ticket data from the LiveHelpNow software, the feature can help monitor and improve call center KPIs. With just a few clicks contact center operators can create attractive displays with clearly displayed real-time data.
Here are the steps to set up a KPI Dashboard:
- Login to your LiveHelpNow account and go to Admin Panel.
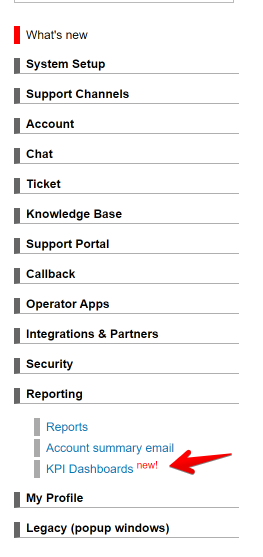
- Select KPI Dashboards under "Reporting" section:
- To create a new dashboard, on the the right side of the screen click New Dashboard:
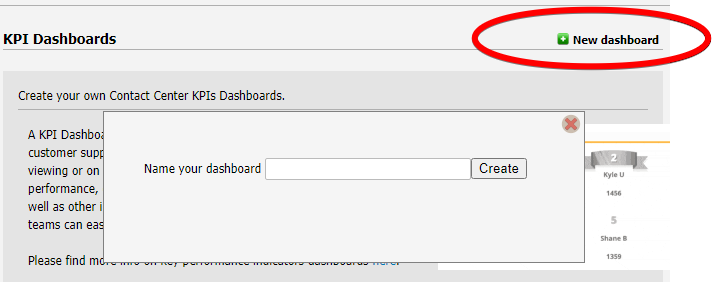
- Then name your dashboard and click Create.
- In the new pop-up window title your dashboard then select the Date Range and select Departments you wish to view from the drop down menu. Once you select a date range, the compassion range will appear. Select a range to compare stats from the previous range.
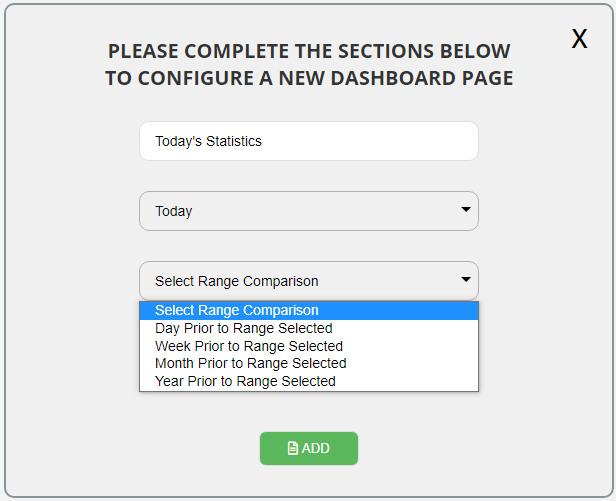
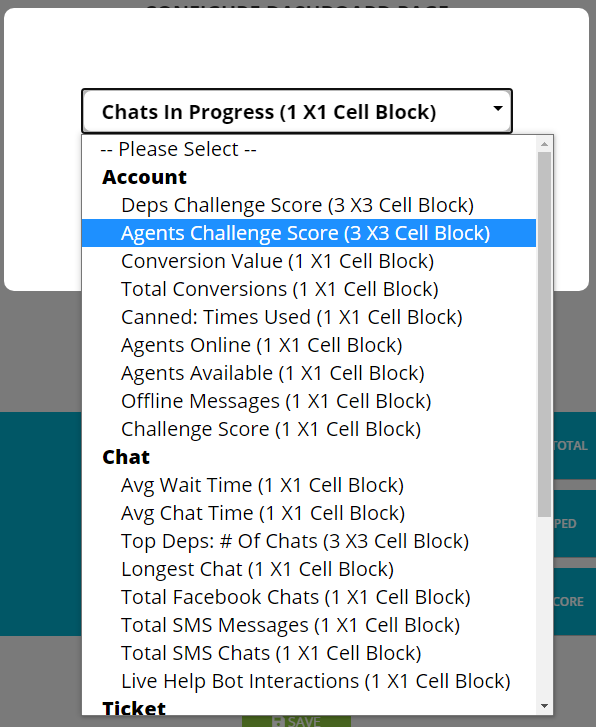
- Click Add. The “Configure Dashboard” page will appear. At the bottom of that page you can click the cells to populate the desired metric:
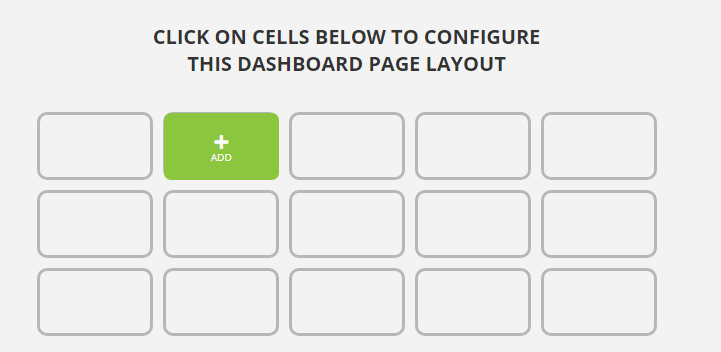
- When selecting a metric, you may choose the display size - either a 1x1 square or 3x3 square
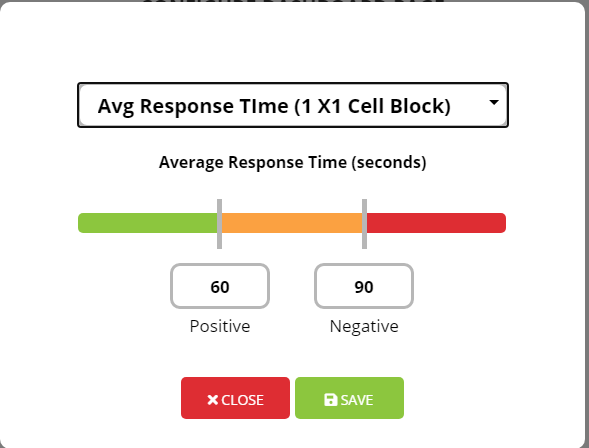
- When selecting certain metrics you will have the ability to choose the positive and negative rating of the data. Move the sliders to metrics you want in green (good), red (bad), and orange (caution):
- Click Save. Now you can go back to the original dashboard screen and click on your new dashboard link.
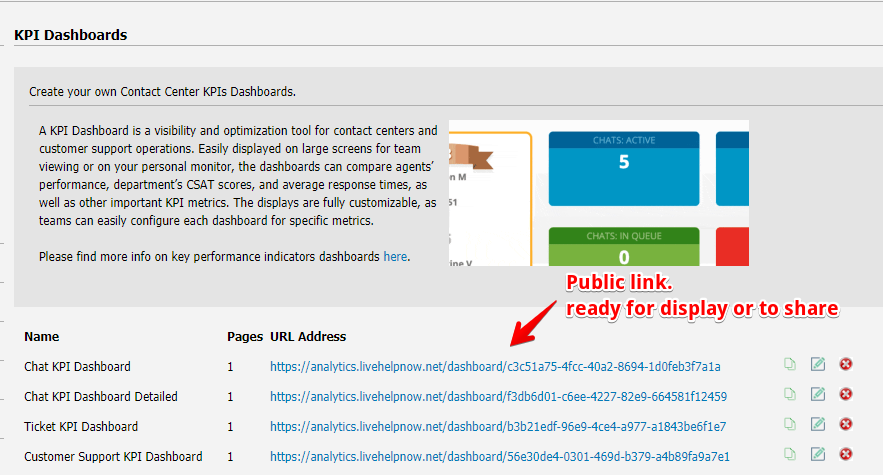
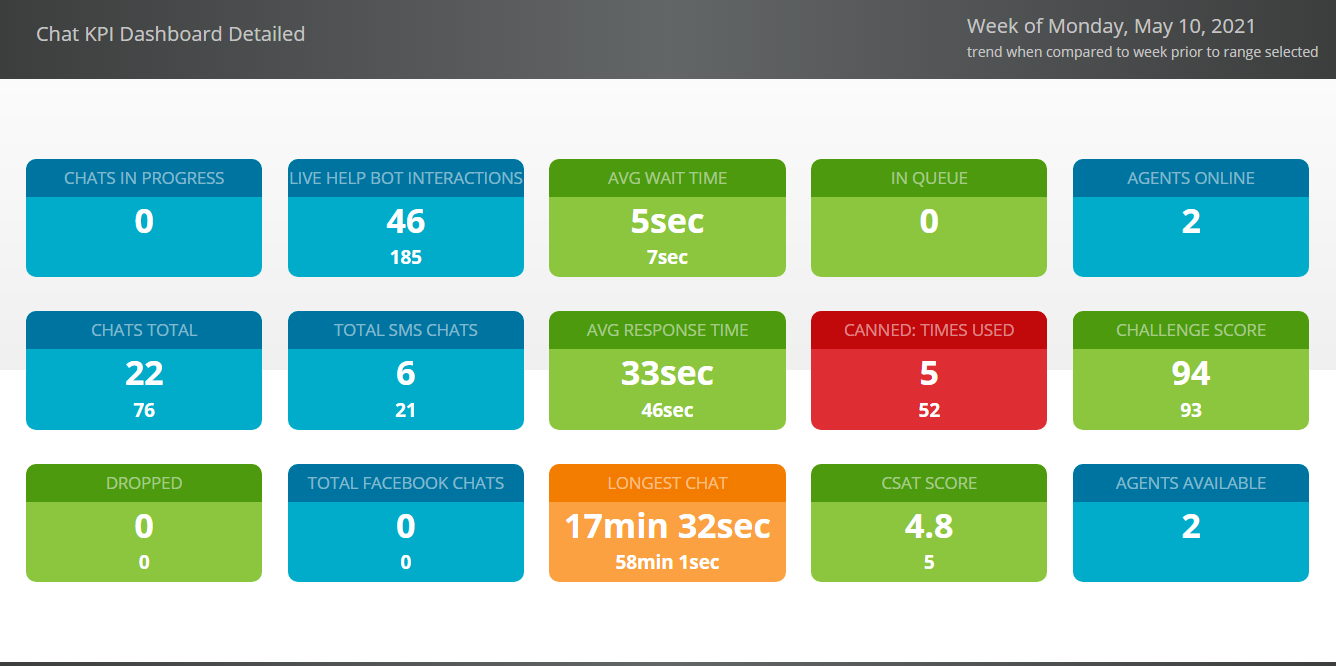
- Now you can view your KPI Dashboard:
The URL for the dashboard is public, so it can be shared with anyone in the organization.
It’s difficult to improve something without measuring it. KPI Dashboards help not only measure, but display real-time results, motivating contact center agents to compete against each other and their own historical numbers. The results can boost the entire team’s performance.
Happy Dashboarding!