
Occupancy and Utilization Report
What is the Occupancy and Utilization report?
What is the occupancy and utilization report?
The occupancy and utilization report is an enterprise level interactive report that will give you better insights into the efficiency of your teams. This report is filterable by department, by Shift or at the full Account level. . Each metric is tracked on a 2 minute interval to give you extremely detailed information and metrics across your team. Each of the four charts provided can display a maximum of seven days of information covering 13 total months to allow you to compare metrics from the past year. Each chart also allows you to zoom in by clicking and dragging the section you would like to view in more detail. Below we will break down each chart and the data available on them.
Occupancy
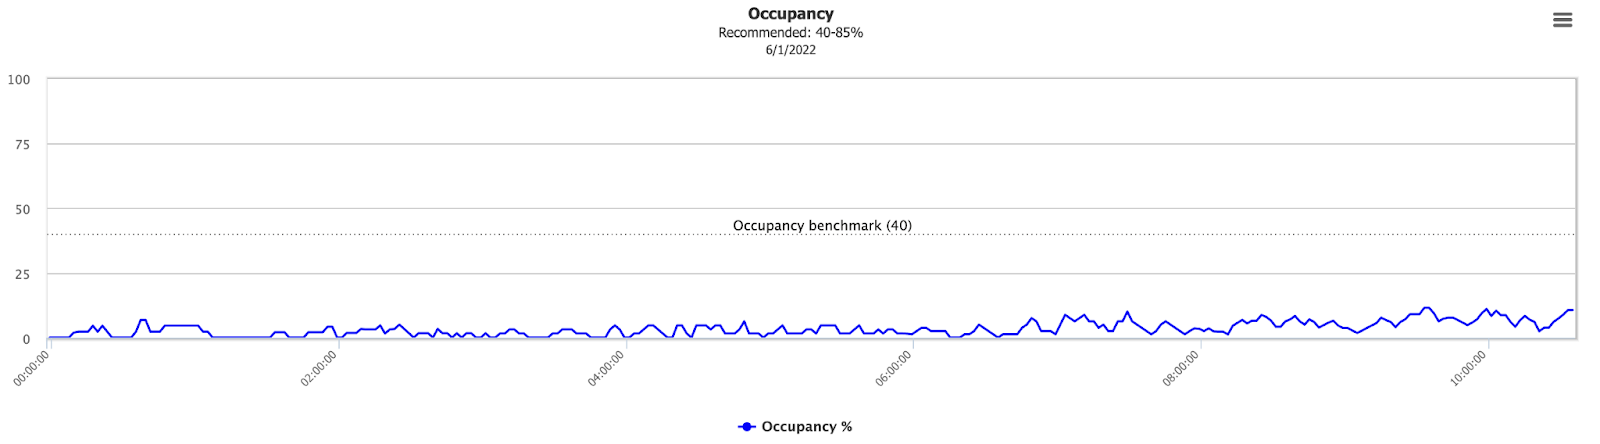
The occupancy chart will show your agent occupancy percentage. This percentage will be based on the agent max chat allowance setting (or a default of 2 if not set) and the chat load each agent is in. For more information of setting max chat allowance, please read this guide or chat with our team at www.livehelplnow.com.
Utilization
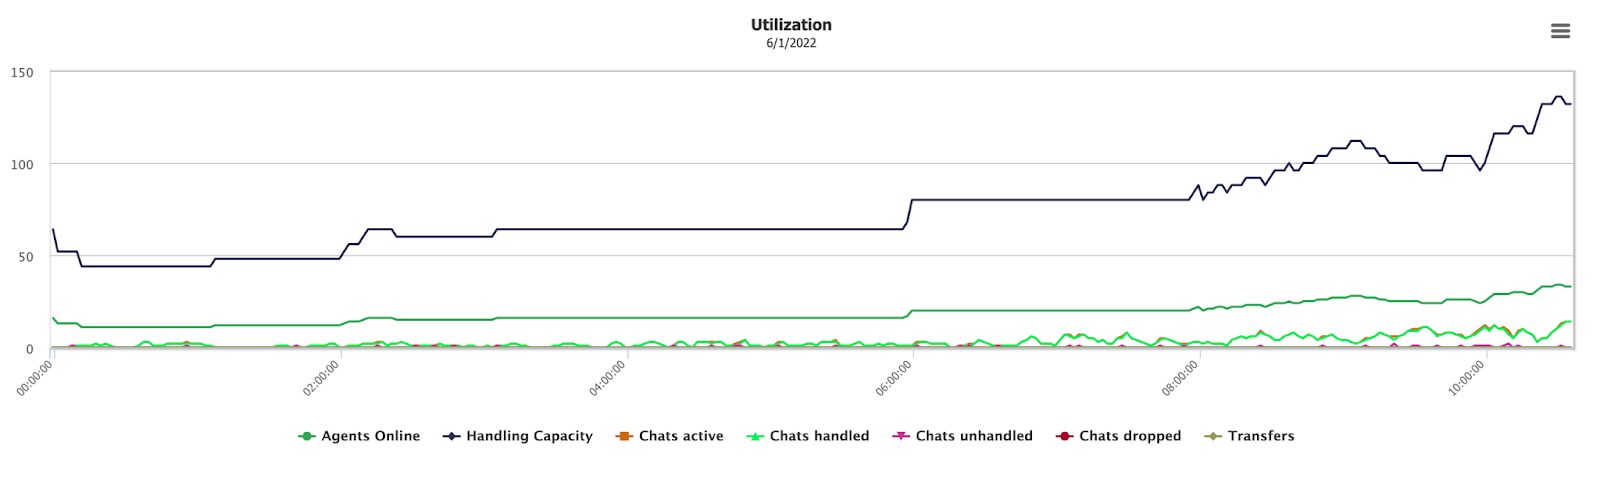
The utilization chart will show a total of seven metrics.
- Agents Online: This is the total number of agents that are logged in and in an online state.
- Handling Capacity: This is the maximum number of chats your team is allocated to take at that moment.
- Chats active: The total number of active chats at that moment
- Chats handled: The total number of active chats that have been accepted by an agent at that moment.
- Chats unhandled: The total number of active chats that have not been accepted yet by an agent at that moment.
- Chats dropped: The amount of chats that have been missed at that moment. This refers to the number of chats that could have been taken as your chat was online and agents were available but the chats were either not accepted by an agent or the customer decided not to continue waiting. These are different from Offline Requests.
- Transfers: The amount of chats that have been transferred at that moment
Handling Times
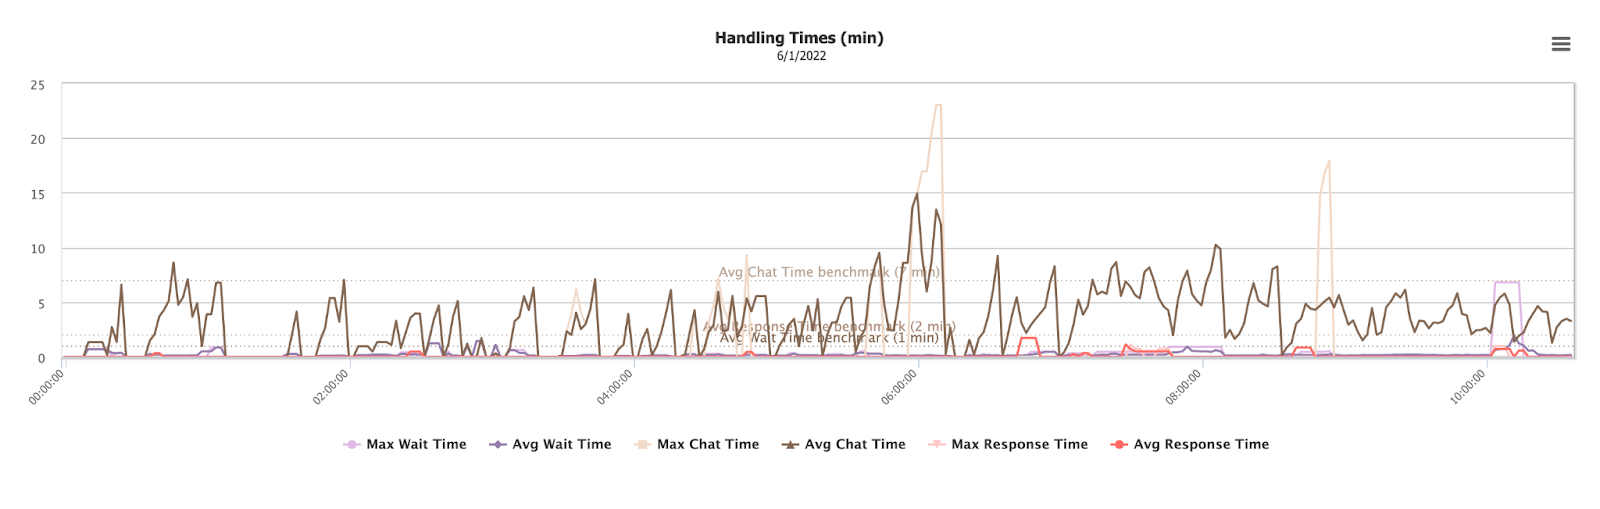
The handling times chart will show a total of six metrics. All of the metrics are displayed in minutes.
- Max Wait Time: The longest a customer spent in the queue waiting to speak with an agent.
- Avg Wait Time: The average duration that a customer spent in the queue waiting to speak with an agent.
- Max Chat Time: The longest duration of chat from the moment the chat was accepted by an agent to the point of chat termination.
- Avg Chat Time: The average duration of a chat from the moment the chat was accepted by an agent to the point of chat termination.
- Max Response Time: The longest that it took an agent to respond to a customer once the chat had been accepted by an agent.
- Avg Response Time: The average time it took for agents to reply to customers once the chats were accepted by an agent.

This chart also allows you to select a point on the metrics in the chart to pull up the chat transcript and detail. This will allow you to easily look into any potential issues without needing to reference other reports.
Visitor Volume
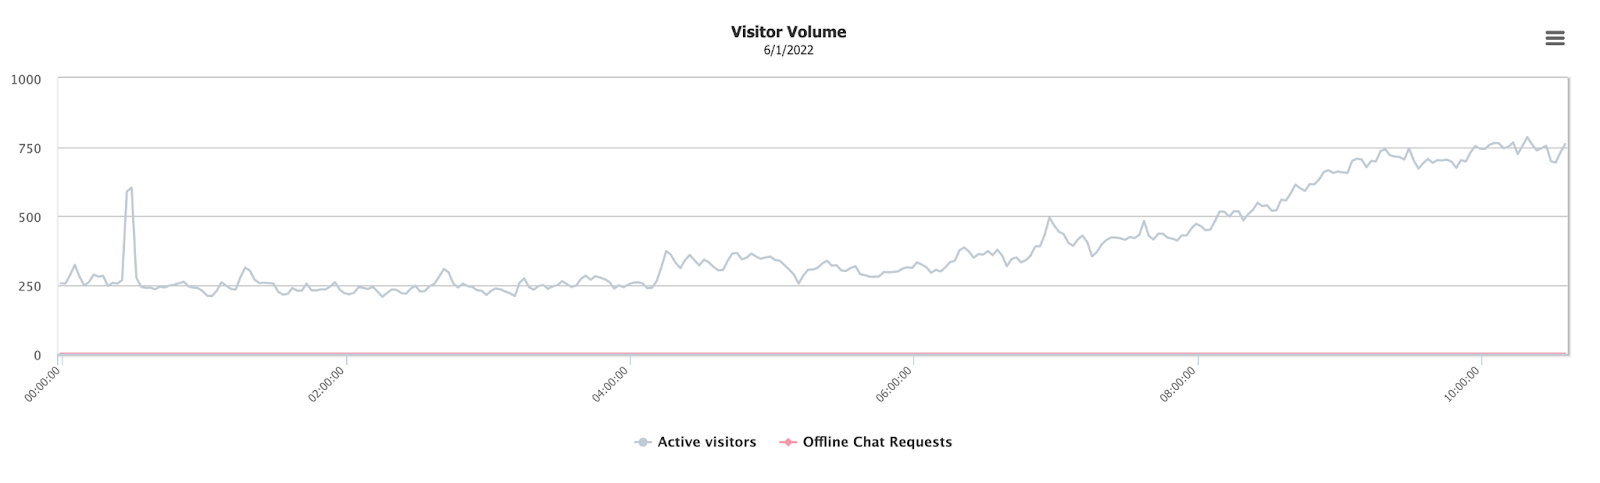
The visitor volume chart will show your site’s active visitors and offline chat requests by time of day. The data can also show the current visitors on your site at that moment.